Example_Plot.py
0.00MB
| Plot Type | Description | |
| Line Plot | Plots data points connected by straight lines |  |
| Scatter Plot | Plots data points as individual dots |  |
| Bar Plot | Plots data as rectangular bars |  |
| Histogram | Shows the distribution of a dataset |  |
| Pie Chart | Shows proportions of a whole | 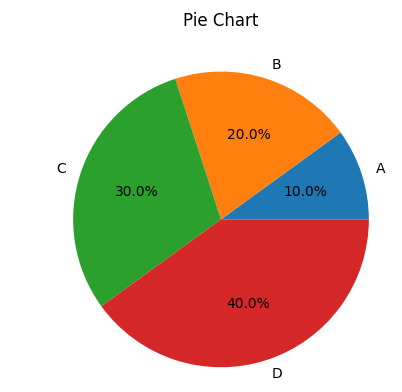 |
| Box Plot | Displays the distribution of data based on a five-number summary |  |
| Violin Plot | Combines a box plot with a kernel density plot |  |
| Heatmap | Displays matrix data as a color-coded image |  |
| Contour Plot | Plots contours of a function of two variables |  |
| 3D Plot | Plots data in three dimensions |  |
'Python' 카테고리의 다른 글
| Python_G-008. Function (0) | 2025.01.16 |
|---|---|
| Python_G-007. List vs Tuple vs set vs dictionary (0) | 2025.01.16 |
| Python_G-005. Loop Type (0) | 2025.01.12 |
| Python_G-004 : 10 basic operations & functions (0) | 2025.01.12 |
| Python_G-003 : Variable Type (0) | 2025.01.12 |