| Verbs | nouns |
 |
 |
 |
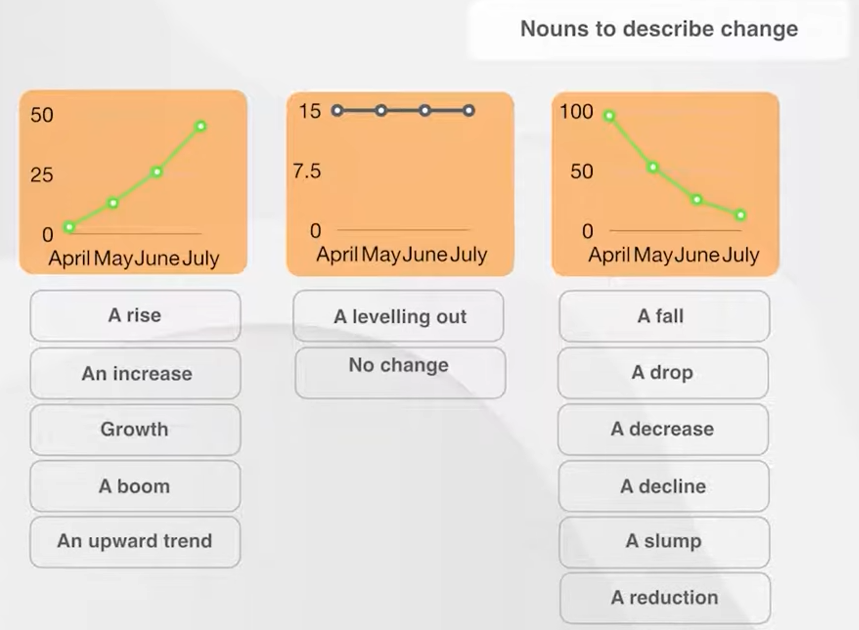
| In January, milkshake sales were 200,000 dollars per months. The chart shows a slight increase to 220 thousand in February, followed by a sharp rise to 350 thousand dollars in March. The chart shows a gradual decline in sales over four months, bottoming out at 120 thousand dollars in July. In August, the chart shows a sharp rise in sales, nearly doubling from 120 thousand dollars in July to 210 thousand dollars. The chart shows a brief dip in September to 120 thousand dollars, followed by a recovery in October, reaching 180 thousand. Sales remained steady through October and November, with a modest increase in December to 190 thousand dollars. |
| In 2019, milkshake sales demonstrated notable fluctuations across the year. The first quarter saw strong growth, peaking in March at 350 thousand dollars. However, this upward trend reversed in the second quarter, with sales steadily declining to a low of 100 thousand in June. The third quarter presented modest recovery and variation—sales rose to 150 thousand in July, dipped again in August, then regained slight strength by September. October and November reflected a stable phase with minimal change, followed by a mild uptick in December, closing the year at approximately 150 thousand dollars. Overall, the data suggests significant seasonality in consumer behavior, with peak performance occurring in early spring and gradual stabilization toward year-end.” |
Reference
Describing Graphs & Charts in English - Free Business English Course - YouTube
반응형
'English' 카테고리의 다른 글
| Describing Graphs - basic 2 (0) | 2025.07.07 |
|---|---|
| Describing Graphs - ex_01 : Divorce Rates in Finland and Sweden (0) | 2025.07.06 |
| Describing Graphs - basic 2 : type of Graph Changes (0) | 2025.07.06 |
| Describing Graphs - basic 1 (0) | 2025.07.06 |
| no longer vs any more (0) | 2025.03.22 |


